

Biofuels
Market situation
Several political changes concerning biofuel markets were finalised in the course of 2015. In Brazil, the taxation system was amended to favour hydrous ethanol rather than gasohol and the mandatory anhydrous ethanol blending ratio was increased from 25% to 27%. In the European Union, revisions to the Renewable Energy Directive (RED) and to the Fuel Quality Directive were adopted. A 7% cap was introduced on renewable energy coming from food and feed crops in the transport sector by 2020. After a long delay, the US Environmental Protection Agency’s (EPA) final rulemaking for the years 2014-16 was issued in November 2015. The mandates specified are higher than those proposed earlier in the year, though still considerably lower than the initial levels proposed in 2007.
World ethanol and biodiesel prices continued to decrease in nominal terms in 2015 due to weak crude oil and biofuel feedstock prices. Demand for bioenergy in the transportation sector was mostly driven by blending mandates in major economies and by sustained fuel use around the world.
Projection highlights
International prices of ethanol and biodiesel are expected to recover in nominal terms over the outlook period, given developments in crude oil markets and the recovery of prices of biofuel feedstock (Figure 3.7). Global ethanol production is expected to expand modestly from 116 Bln L in 2015 to 128.4 Bln L by 2025. Half of this growth will originate from Brazil.
The expansion of global biodiesel production will be driven by policies in place in the United States, Argentina, Brazil and Indonesia, and to a lesser extent the fulfilment of the RED target in the European Union. It is expected to increase from 31 Bln L in 2015 to 41.4 Bln L by 2025. Advanced biofuels are not expected to take off over the projection period.
For the United States, this Outlook assumes that the 10% ethanol blend wall will continue to limit growth in ethanol use, that biodiesel use will expand due to a stronger advanced mandate and that cellulosic ethanol will not be available on a large scale. The cellulosic mandate will be mostly met with renewable compressed natural gas and renewable liquefied natural gas. In the European Union, the proportion of total transport energy accounted for by biofuels, including double counting for sustainable biofuels is expected to reach 6.3% by 2020. The remainder of the 10% RED target will be met from other renewable energy sources such as electric cars.
In Brazil, it is assumed that prices will remain favourable to hydrous ethanol use rather than gasohol and thus a sustained demand for ethanol, mostly met by domestic production, will prevail over the outlook period. Indonesian biodiesel production will be used mainly to meet domestic mandate-driven demand. For India, the new policies aiming at compensating sugar mills for high sugar prices will encourage ethanol production from molasses.
Elsewhere in the world, development of the comparatively minor biofuels markets depends on a mix of effective policy support and price trends, leading to mixed prospects across countries.
Biofuel trade will remain limited. It is expected that ethanol exports will mostly originate from the United States where the blend wall limits further increases in domestic demand, and that biodiesel trade will be mostly directed from Argentina to the United States in order to meet the biodiesel and advanced mandates. Indonesian exports of biodiesel are expected to remain marginal given high tariffs imposed by importing countries
The future evolution of energy markets as well as possible policy changes are key uncertainties attached to the Outlook for biofuel markets over the next decade. However, given recent policy decisions, uncertainties concerning the future of biofuel markets should ease somewhat, at least over the short-term.
Figure 3.7. World biofuel prices
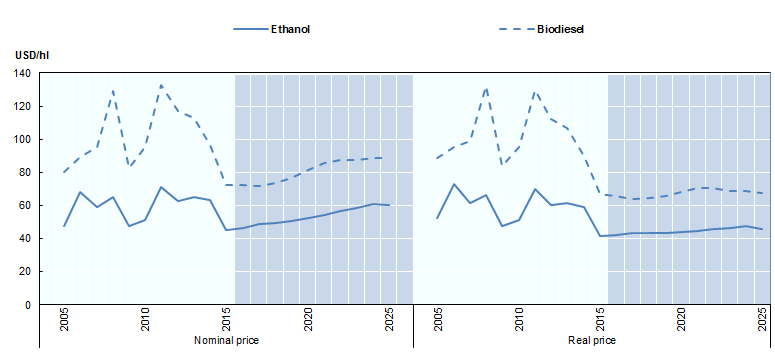
Note: Ethanol: wholesale price, US, Omaha; Biodiesel: Producer price, Germany, net of biodiesel tariff and energy tax.
Source: OECD/FAO (2016), “OECD-FAO Agricultural Outlook”, OECD Agriculture statistics (database), http://dx.doi.org/10.1787/agr-data-en.
» Access the biofuels chapter and all graphs on the OECD iLibrary