

Dairy and Dairy Products
Market situation
International prices of all dairy products continued to decline from their 2013 peak, in particular for skim milk powder (SMP) and whole milk powder (WMP). A key factor was the decline in Chinese import demand, with demand for WMP dropping by 34% from 2014 levels. This decrease in Chinese demand for dairy products was coupled with continued production growth between 2014 and 2015, in key export markets, with total output of milk increasing in Australia (4%), the European Union (2%), New Zealand (5%) and the United States (1%).
The Russian Federation’s ban on imports continues to restrict dairy trade. Russian cheese imports dropped by 62% between 2013 and 2015, which mainly affected exports from the European Union, the United States and Australia. Conversely, Belarus has greatly increased cheese exports to the Russian Federation, supplementing demand there. The ban is assumed to continue until the start of 2017; with imports of cheese expected to increase sharply as trading resumes, mostly supplied from the European Union and the United States, albeit at lower levels than prior to the ban.
Production in Oceania is facing challenges, low dairy prices have caused a reduction in the total dairy herd, which dropped by 2.7% in 2015. Furthermore drought and adverse weather conditions related to a very strong El Niño have restricted production in Oceania’s pasture-based systems in 2016; this is expected to reduce production in New Zealand by 6.8% and to stall growth in Australia.
Previously good margins combined with the removal of the EU milk quota as of April 2015 has promoted growth in total milk production in the European Union. This growth, however, has been uneven across member states. For example, milk deliveries from the 2014 to 2015 marketing year (April-March) increased by 18.5% in Ireland, 3.7% in Germany, 2.9% in the United Kingdom, and 11.9% in the Netherlands. With increased milk production and limited growth in domestic consumption, EU exports for all major dairy commodities on aggregate are expected to increase by 58.5% between the 2013-15 base years and 2025.
Projection highlights
Per capita demand for dairy products in developing countries is expected to grow consistently over the medium-term, supported by rising incomes and lower dairy prices relative to their 2013 peak. As seen in previous years there is a continued shift in dietary patterns away from staples and towards animal products, due to changes in diets. Strong consumption growth is expected across several markets in the Middle East and Asia, including Saudi Arabia, Egypt, Iran and Indonesia, with the per capita consumption of dairy products in developing countries growing between 0.8% and 1.7% p.a., the lowest growth being for cheese and the highest for fresh dairy products. In addition, per capita consumption in the developed world is expected to grow between 0.5% for fresh dairy products and 1.1% p.a. for SMP.
World milk production is projected to increase by 177 Mt (23%) by 2025 compared to the base years (2013-15), corresponding to an average grow rate of 1.8% p.a. which is below the 2.0% p.a. witnessed in the last decade. The majority of this growth (73%) is anticipated to come from developing countries, in particular India and Pakistan. This expansion of production is largely in fresh dairy products, which will grow at 2.9% p.a. in developing countries, and predominantly supply domestic markets. At the world level, production of the main dairy products (butter, cheese, SMP and WMP) is increasing at similar pace to milk production, albeit more slowly than that of fresh dairy products.
As a result of these demand and supply factors, nominal prices of all dairy products are expected to increase over the medium-term, along with real prices of milk powders, which recover from their current lows. The real prices of butter and cheese are expected to decline slightly over the next decade, although this is from a comparatively higher base level than for milk powders.
The strengthening of both the US Dollar and the euro will put pressure on the growth of exports from the United States and the European Union, as they become less competitive on the global market. Conversely, exporters in Argentina, Australia and New Zealand are projected to become more competitive on the world market due to relatively weaker currencies.
Continued export growth is expected over the coming decade following the slump in 2014-15. Butter, cheese, SMP and whey all average strong growth of over 2%. Growth for exports of WMP is more modest at 1.8% p.a. With low dairy prices serving as a barrier to market entry for non-traditional exporters, export growth will continue to be satisfied by a small concentration of key exporters. The European Union will be the principle exporter of SMP and cheese, and New Zealand the lead exporter of butter and WMP, as shown in Figure 3.5.
Figure 3.5. Exports of dairy products by region
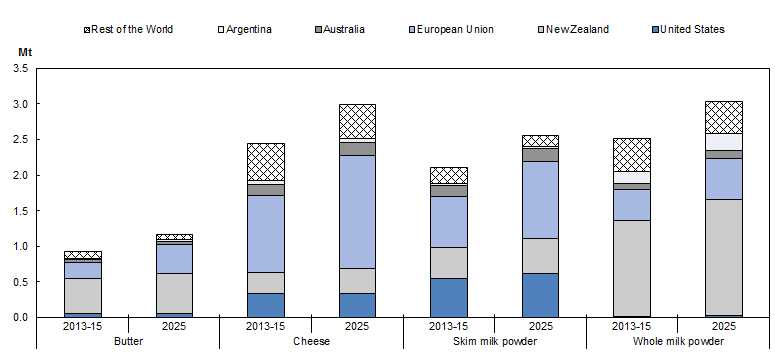
Source: OECD/FAO (2016), “OECD-FAO Agricultural Outlook”, OECD Agriculture statistics (database), http://dx.doi.org/10.1787/agr-data-en.
The global dairy commodity market is prone to disturbances from weather variability, changes in policy, and the opening or closing of trade in key countries. Many of the developments in the dairy market will stem from import demand in the China and how quickly producers react to lower prices. The Outlook foresees a strengthening of demand from developing countries and assumes that while China does not resume importing WMP and butter at 2014 levels, instead servicing much of its demand internally, SMP and cheese imports will increase over the outlook period.
» Access the dairy chapter and all graphs on the OECD iLibrary